To Do
- Complete and submit DHF abstract
- Write algorithms and implement temporal sets
- Marriages are perfect examples, see May 9 meeting
- Build table structure for extended marriages (tribes?) so we don’t have to build them on the fly from the DB every time.
-
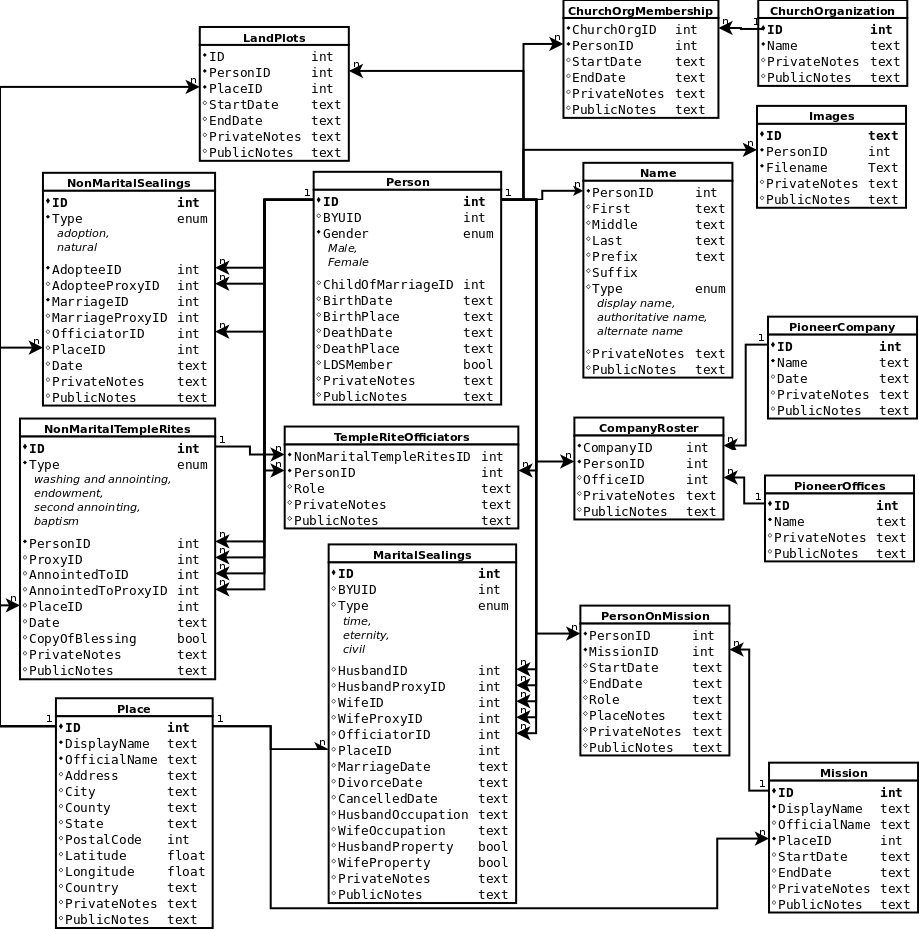
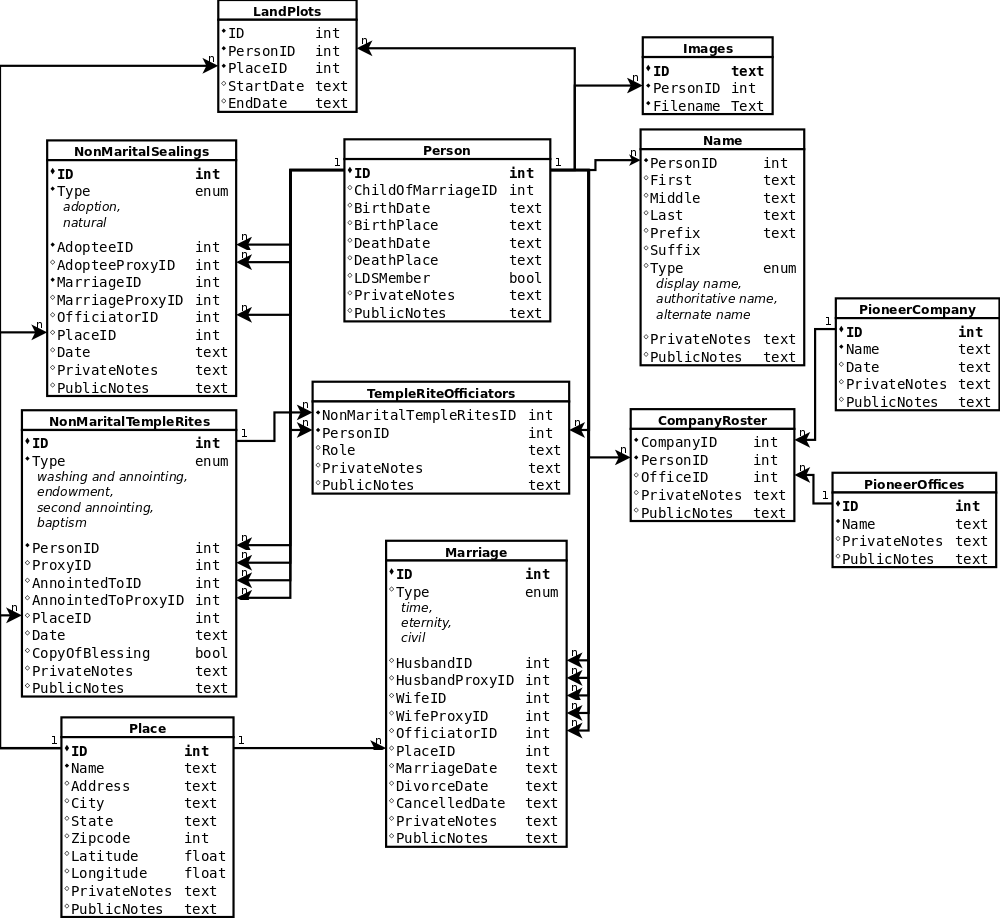
Build the database and scripts to import Jill’s data
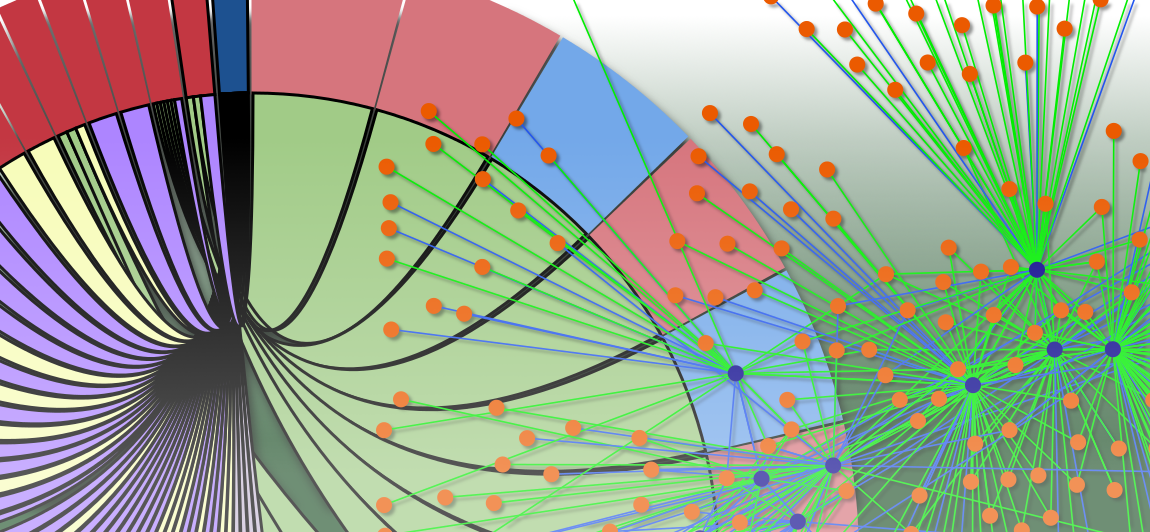
- Directed graph viz with a person, the marriages they are linked to (adoption, birth, marriage)
- Add levels of separation to sankey (0 is just the marriage requested, 1 would be their parents’ marriages and children’s marriages, etc)
Discussion on Abstract
We want to depict the CS side, with strong Humanities application
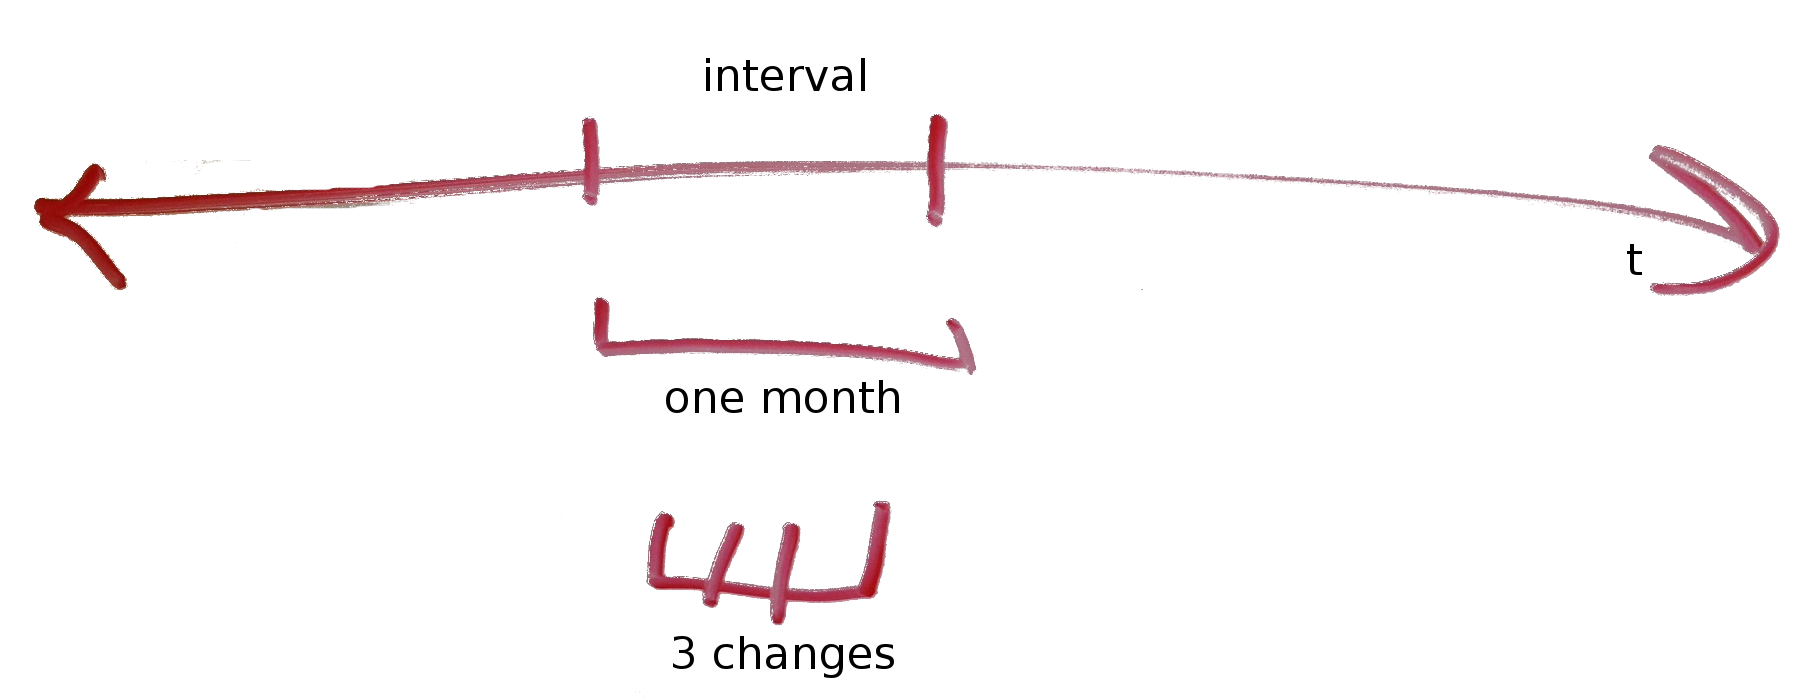
- Lead with temporal nature of the data/work
- Temporal: metronome axis (time in min/sec/etc) vs action/change oriented (time as series of events)
- Evolving structures : marriages evolve
- Within marriage
- changes at events such as new wife, child born, wife dies, etc
- It’s still the same item! It changes while maintaining its identity
- Observe how networks/communities evolve
- Identity: Objects have identities, even though they are evolving structures
- Marriages have an identity that stays the same, even though participants come and go
- People (marriage-to-marriage) have identities. People constitute these things (marriages, groups)
- The entire network has some identity. “Process that’s happening”
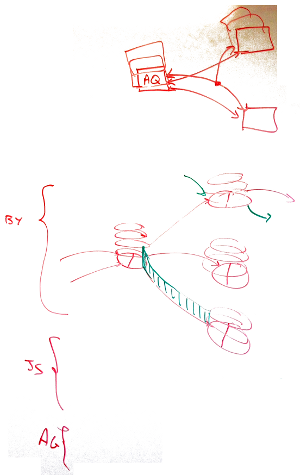
- Church organizations (AQ, Q12,…) have identities, but change over time
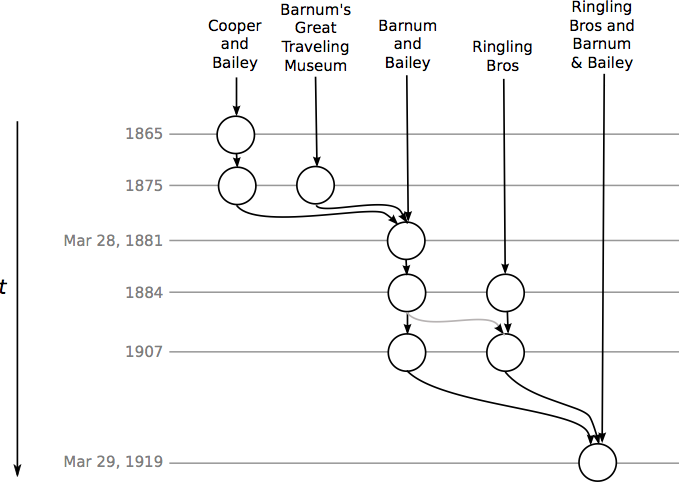
- Merging organizations, splitting organizations, relations between them (people they share). Can also think of this in a corporate sense, such as the previous circus example.
- Tribes: Marriages come and go from the tribe, but collections of marriages also have an identity
These are networks of objects that are morphing/evolving/temporal! We need to get this across, and fully embrace it.
 .
. .
.