This page does not represent the most current semester of this course; it is present merely as an archive.
In this lab you'll write code to re-create the cover image of the textbook. You'll also guess how many caches your computer has and how large they are.
This program uses only plain C code and is designed to work on may systems. You are welcome to do it on any computer you wish.
Download fcyc2.h, fcyc2.c, clock.h, and clock.c. clock.c is a set of routines to access the highest-precision timer available on many different platforms, as well as to a function that returns your computer's clock speed: mhz(0). You could use the timing methods directly, but fcyc2.c provides a function
double fcyc2(test_funct f, int param1, int param2, int clear_cache)which takes in a function pointer f, two parameters to be forwarded to f, and a boolean flag indicating if the cache should be flushed before f is run or not.
You would call fcyc2 as
void test(int param1, int param2) { /* this is the function to time */ }

double timeOf(int a1, int a2, double Mhz) {
    double cycles;
    test(a1, a2);                    /* warm up the cache         */
    cycles = fcyc2(test, a1, a2, 0); /* times test(a1, a2)        */
    return (cycles / Mhz);           /* convert cycles to seconds */
}
*You can find more involved versions of this code in figure 6.42 on page 622 of the textbook.
The implementation of fcyc2 does its best to get rid of delays caused by the operating system and other programs running at the same time by running the function many times and keeping the bes time.
Make a file cachemeasure.c to measure your cache.
If you hit a low-level cache, you'll get a faster time than if you do not. You hit a cache if you have good spatial and temporal locality. We can manipulate spatial locality by accessing an array with a large stride: accessing a[0], a[1], a[2], etc. has better locality than a[0], a[8], a[16], etc. We can manipulate temporal locality by accessing more data overall. The following method realizes this:
#define MAXBYTES (1<<28) /* you might want to change this value */
#define MAXELEMENTS (MAXBYTES/sizeof(double))

double data[MAXELEMENTS];

void testme(int elements, int stride) {
    int i; double result;
    data[0] = 0; /* keeps repeated runs from creating infinity */
    for(i = 0; i < elements; i += stride) {
        result += data[i];
    }
    data[0] = result; /* keeps optimizer from removing the loop */
}
Make a main method that times a method like testme with many different strides and sizes. To duplicate the book's image directly, use strides 1 through 16, 32, and 64 and byte-sizes 1<<12 through 1<<25 by powers of two (double-sizes 1<<9 through 1<<22). I found my computers had a larger cache and I needed a bigger max size in order to get interesting results.
Report your time in units of megabytes per second: (size / stride) / (cycles / Mhz) where cycles is the result of fcyc2 and Mhz is the result of mhz(0). Figure 6.42 provides one example of how to do this.
Output your results with printf, one sample per line, with a blank line between each set of datum with the same stride, like so:
/* initialize all data so the optimizer doesn't remove it */

for each size {
    for each stride {
        double MBperSec = /* call your timing method here */
        printf("%d %d %.1f\n", stride, size, MBperSec);
    }
    printf("\n");
}Linux systems generally have a program called gnuplot installed. If yours doesn't, you can install it using sudo apt-get install gnuplot.
gnuplot is a versatile program that can create many different kinds of graphs. Run it by
linux> gcc -O1 cycle.c fcnt2.c cachemeasure.c -o cachemeasure
linux> ./cachemeasure > datafile
linux> gnuplot
and then type in gnuplot commands. To get an image similar to the textbooks, try
set terminal png size 800,800 enhanced font "Helvetica,10"
set output 'mountain.png'
set logscale y
set pm3d
set yrange [268435456:2048]
set zlabel 'throughput'
set xlabel 'stride (x8 bytes)'
set ylabel 'size (bytes)'
splot 'datafile' with lines
exit
You can also download those commands as mountain.gnuplot and run them as
linux> gnuplot mountain.gnuplotif you prefer that to typing them directly.
Things you might want to change in the gnuplot commands:
The set yrange line's numbers should be your range of generated sizes. 268435456 should match your maximum size; the 2048 should match your minimum size. If you change the sizes you generate, change those values too. You can verify your biggest size with sort -n datafile -k 2 | tail -1 and you smallest with sort -n datafile -k 2 | head -1
If you do not enter the set terminal and set output lines, you'll get a pop-up window with the image instead of a saved file.
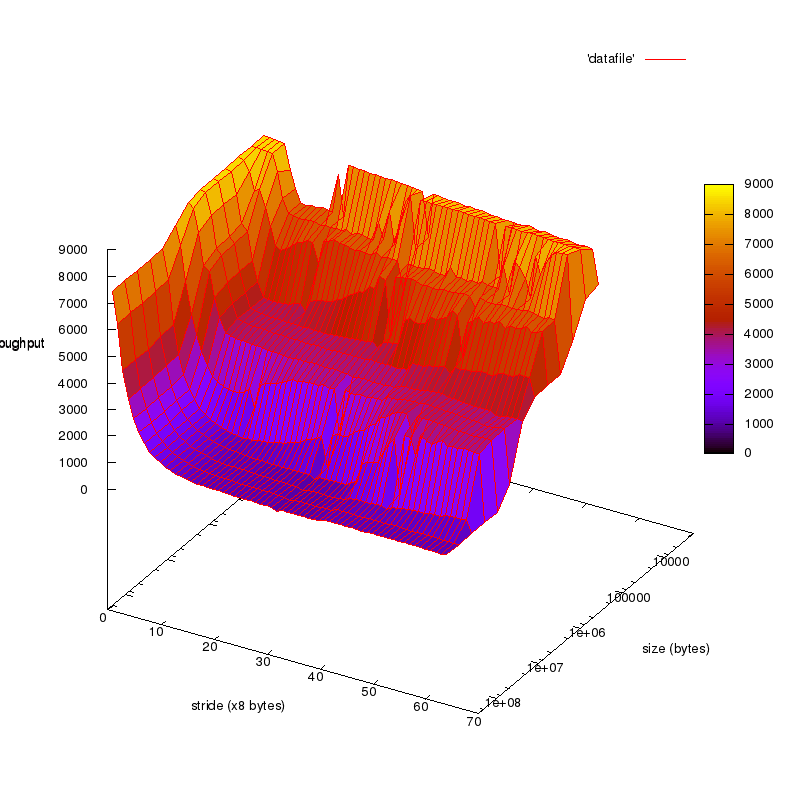
You will now have a file named "mountain.png" that is your version of the memory mountain.
Look for the following:
Have you hit a size after which bigger ≠ slower? What size was that?
Often there will be some size at which your performance bottoms out at a stride less than maximum, like
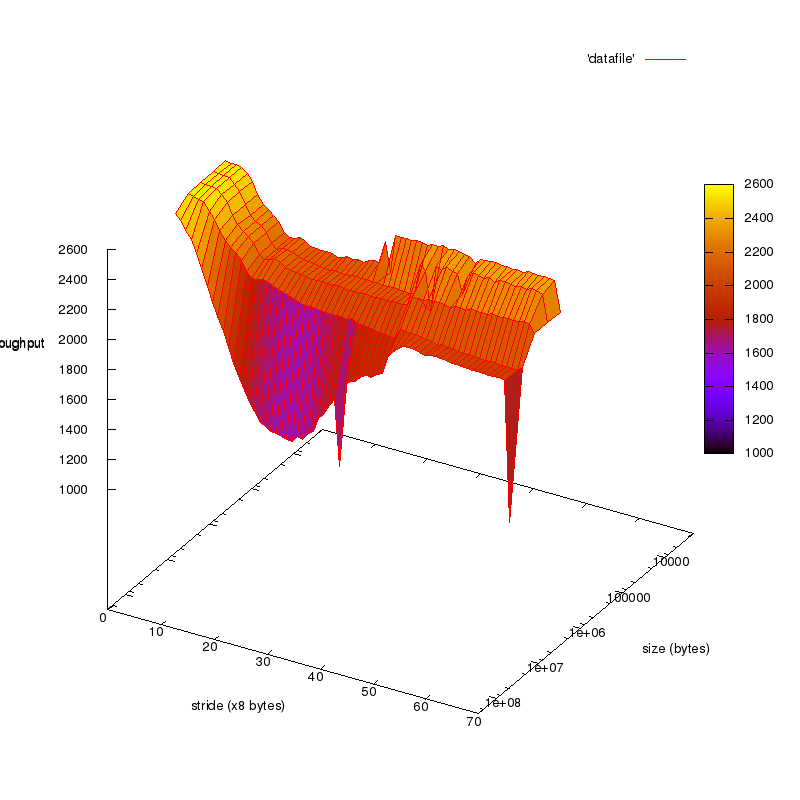
Do you see these local minima? Where? Why are they are that stride? Why only on those sizes?
How many levels of cache does your computer have? How large are they each? (see Figure 6.44 and 6.45 for suggestions on how to answer these questions)
If you have access to a second computer, try the code on that computer too. How are the caches organized on that machine? Does it have faster or slower overall memory throughput?
Submit your cachemeasure.c and datafile. Include a comment in your cachemeasure.c that says which computer your datafile was generated using. You may optionally also submit one or more mountain.png images if you'd like us to discuss them in class.