Matlab Simulation
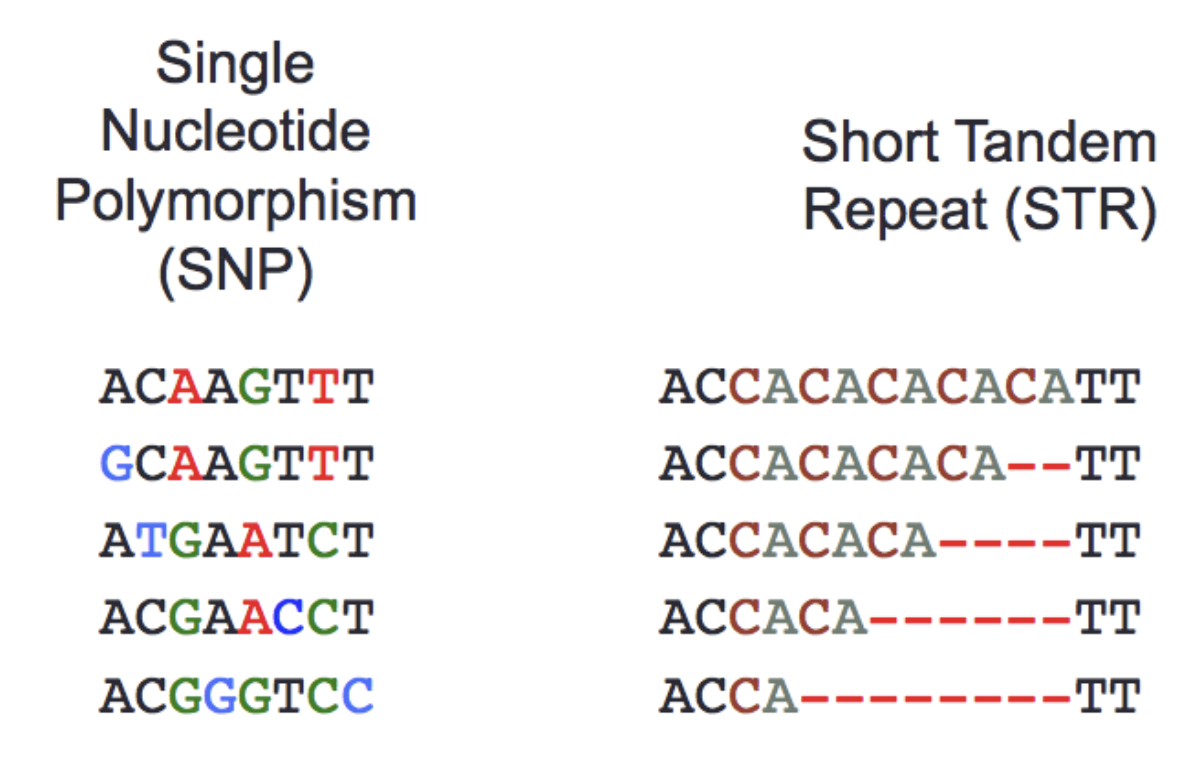
A simulation of a population of 10000 people over 4 generations was performed using a matlab script. The goal of the simulation was to test different numbers of loci of genes for forensic investigation to determine the likelihood of being able to confirm familial relations between two sets of DNA. Simulations were done of using SNPs, or single nucleotide polymorphisms, with a probability of 1/2 for simplicity. This means that half of the starting population had one version or allele of the gene while the other half had another version, representing two basepair possibilities for each locus. Current technology uses STRs, or short-tandem repeats, which are repeating sequences that appear in varying numbers in the population. However, there are a limited number of STR loci (around 20 are used currently and up to 500 with better sequencing) that can be analyzed while as technology improves, hundreds of thousands of SNP loci can provide a considerable increase in statistical power.
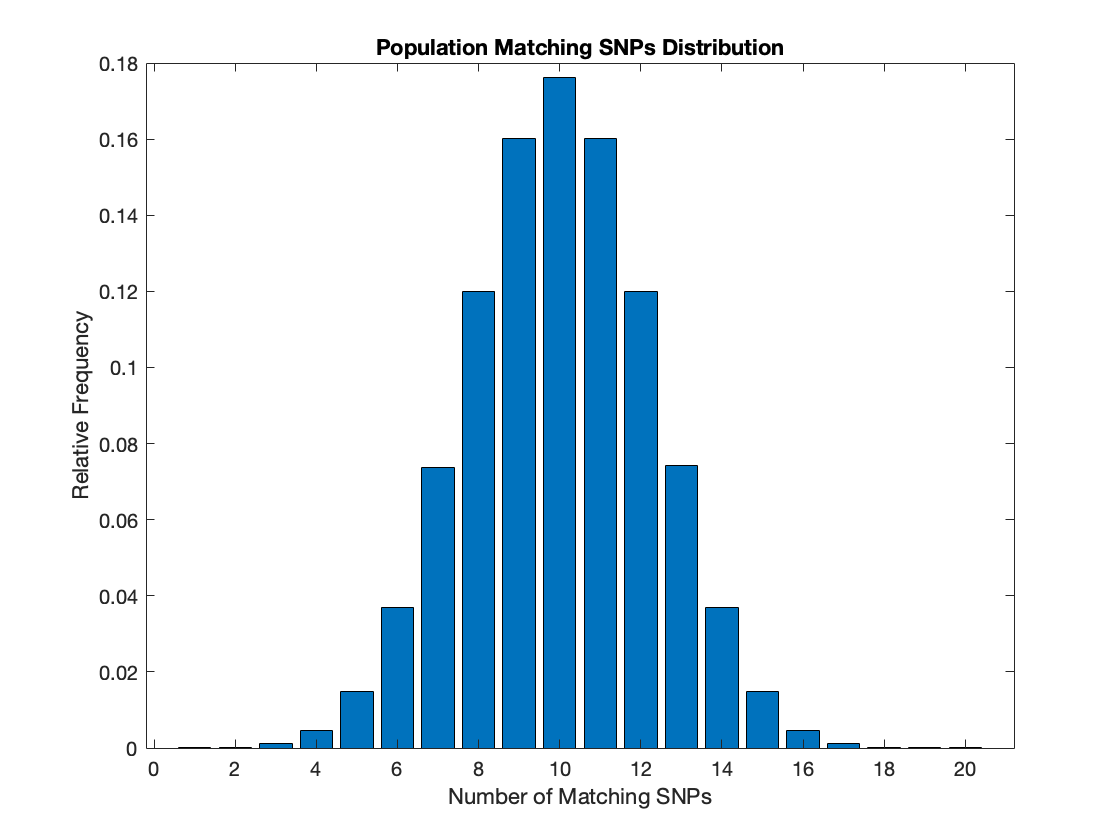
First Simulation: 20 SNPs
The first analysis was done on a dataset with 20 SNPs. Each SNPs were randomly distributed within the population to begin with, and progeny received half of their SNPs from each of their parents. To make the simulation simpler, half of the population randomly pairs with a partner from the other half and had two children. Family ties, up to 4th cousins, were tracked. Additionally, the distribution of pair-wise matching SNPs among the entire population was graphed as a histogram above.
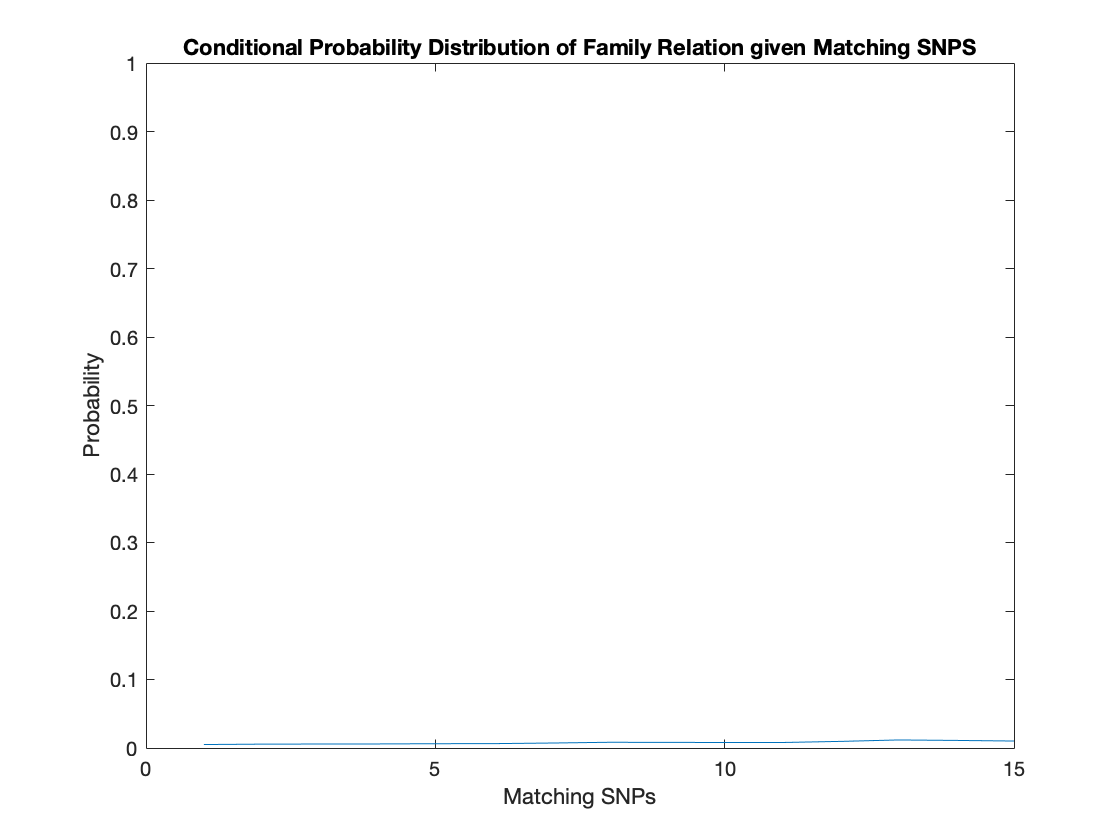
Low Statistical Power
A line graph of the conditional probability of a pair of population members being family given the number of matching SNPs is below. Notably, the line seems almost linear with even 20 matching SNPs only having a 3% chance of indicating familial relation. This means that even with a perfect match of 20 SNPs, the probability of that match not being random is quite low.
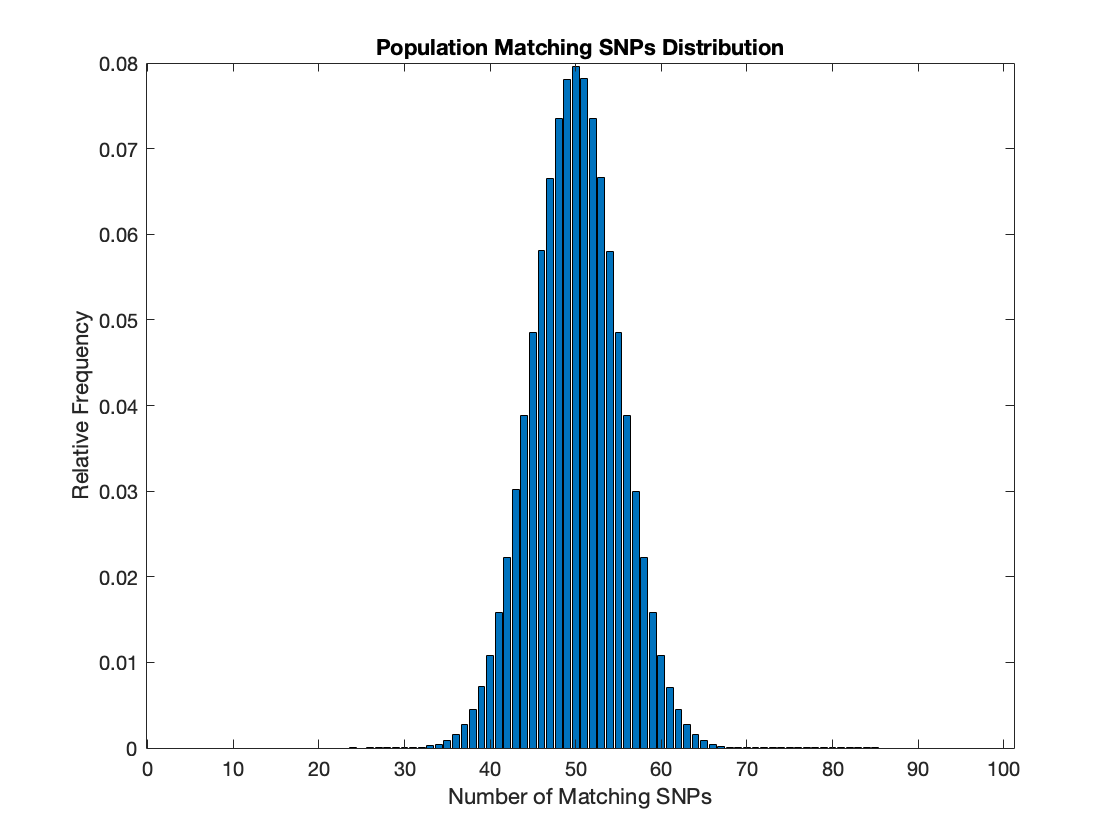
Second Simulation: 100 SNPs
A second simulation was done after the first using more SNPs to evaluate the performance of more loci for use in forensic analysis with improving technology in terms of recovering and sequencing DNA found in crime scenes. This simulation had 100 SNPs or 5x the previous simulation. This resulted in a pairwise distribution that was tighter relative to the sample space range than the previous simulation. This is likely because probabalistically a perfect match of 100 SNPs is exponentially less likely than a perfect match of 20 SNPs.
High Statistical Power
A line graph of the conditional probability of familial relation was again created. This time there is a clear trend of increasing chance of familial relation as you get more matching SNPs. The probability approaches 100% as the matching SNPs reach 70. There is a very good chance of familial relation with a high level of matching SNP in the distribution. Thus, as opposed to the earlier simulation, using more SNPs provides forensic scientists with a lot more statistical power to identify DNA segments.
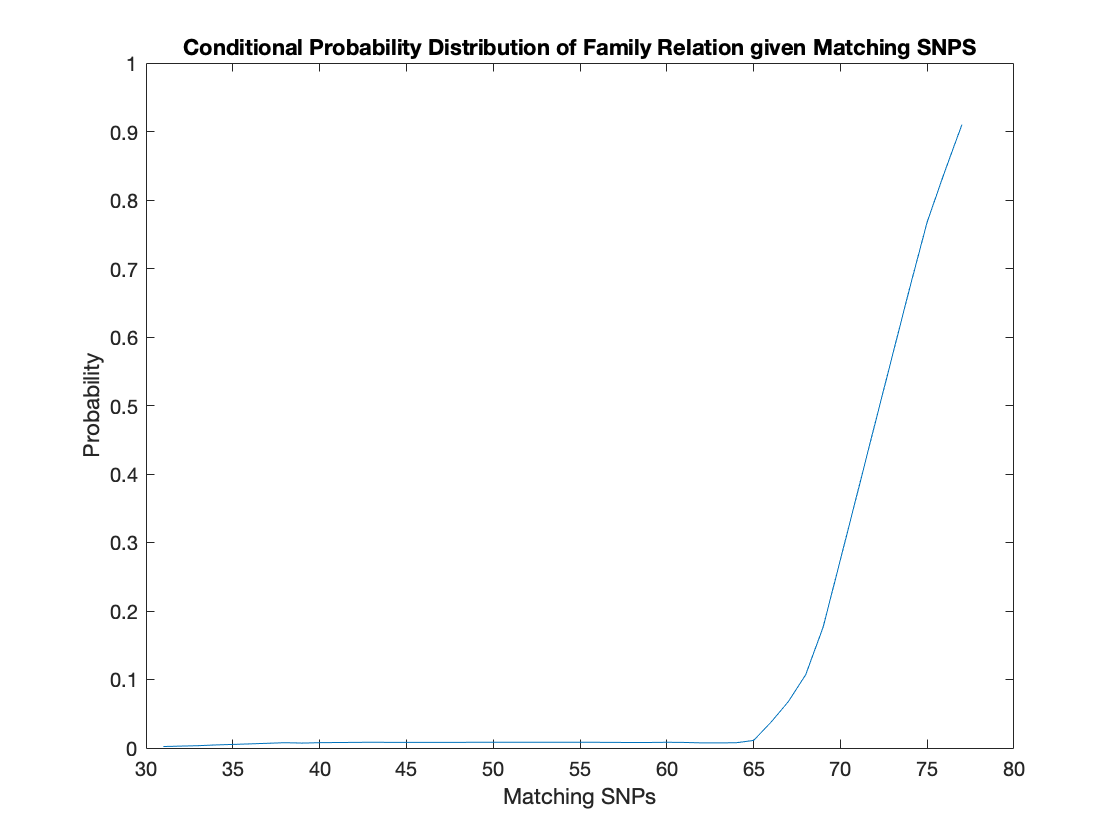
The trend of the above graph showcases the statistical power of more loci in analysis.
Matlab Code
popSize = 10000;
generations = 4;
numAlleles = 100;
sample = 10^7;

AlleleFreqs = 0.5 * ones(1,numAlleles);

RandSNPs = rand(popSize,numAlleles);
for i = 1:numAlleles
    RandSNPs(:,i) = RandSNPs(:,i) < AlleleFreqs(i);
end
population = zeros(popSize,numAlleles,generations);
families = zeros(popSize,2^(generations + 1),generations);
for i = 1:generations
    indices = randperm(popSize);
    for j = 1:popSize/2
        if i == 1
            family = [indices(2*j - 1)+ (i)*popSize indices(2*j)+ (i)*popSize];
        else
            family = [families(indices(2*j - 1),:,i - 1) families(indices(2*j),:,i - 1) indices(2*j - 1) + (i)*popSize indices(2*j) + (i)*popSize];
        end
        famZeroPad = zeros(2^(generations+1),1);
        famZeroPad(1:length(nonzeros(family)),1) = nonzeros(family);
        AlleleIndices = randperm(numAlleles);
        population(2*j - 1,AlleleIndices(1:numAlleles/2),i) = RandSNPs(indices(2*j - 1),AlleleIndices(1:numAlleles/2));
        population(2*j - 1,AlleleIndices(numAlleles/2 + 1:numAlleles),i) = RandSNPs(indices(2*j),AlleleIndices(numAlleles/2 + 1:numAlleles));
        AlleleIndices = randperm(size(AlleleFreqs,2));
        population(2*j,AlleleIndices(1:numAlleles/2),i) = RandSNPs(indices(2*j),AlleleIndices(1:numAlleles/2));
        population(2*j,AlleleIndices(numAlleles/2 + 1:numAlleles),i) = RandSNPs(indices(2*j),AlleleIndices(numAlleles/2 + 1:numAlleles));
        families(2*j-1,:,i) = famZeroPad;
        families(2*j,:,i) = famZeroPad;
    end
end

dotProds = zeros(popSize,'int16');
for i = 1 : popSize
dotProds(i,i+1:end) = sum(squeeze(population(i+1:end,:,generations)) == squeeze(population(i,:,generations)),2);
if (mod(i,1000) == 0)
disp(i)
end
end

dotProdsList = nonzeros(dotProds);

probabilities = histc(single(dotProdsList(randperm(length(dotProdsList),sample))),1:numAlleles)/sample;

arr = zeros(numAlleles,1);
count = zeros(numAlleles,1);
for k = 1:100
for j = 1:numAlleles
for i = find(dotProds(k,:) == j)
arr(j) = arr(j) + (max(floor(intersect(families(k,:,generations),families(i,:,generations)) / 10000)) > 0);
count(j) = count(j) + 1;
end
end
end


plot(movmean(arr./count,10));
figure;
bar(probabilities);