This web page contains the slides and commentary from the keynote
address at the Third Annual IEEE Workshop on Workload Characterization, held
in Austin, TX, on September 16, 2000
Commentary not in the original slides is added in green.
An Industry Perspective on Performance Characterization:
Applications vs Benchmarks
John D. McCalpin, Ph.D.
Senior Scientist
IBM
September 16, 2000
An Industry Perspective on Performance Characterization:
Applications vs Benchmarks
Applications are the reasons why people buy computers.
Benchmarks should be standardized, concise distillations
of the "important" features of those applications.
Micro-Benchmarks attempt to single out
one feature at a time. e.g., STREAM
Application Benchmarks attempt to cluster features
in a "representative" manner. e.g., SPEC
Audiences
Users of Benchmarks include:
people who buy computers
people who sell computers
people who design computers
Purchasers of computers want the benchmarks to tell
about performance on a set of target applications
Sellers of computers want the benchmarks to tell
enough about performance to get the purchaser's attention.
Designers of computers want the benchmarks to represent
the "important" details of the applications so that they can be used as
"concise distillations" in the design process.
Performance Characterization is the means by which
those distillations should be judged.
One might expect that the assemblers of industry
standard benchmark suites would already have made the quantitative evaluations
of the benchmarks vs important applications. The following quote
gives an indication of how the SPEC CPU committee has historically
seen its role in this respect:
Example: SPEC CPU Benchmarks
"The goal of the SPEC CPU benchmarks is to provide
a standardized performance metric that is better than Dhrystone or MHz."
(an anonymous, but important, person
in the SPEC organization)
But I certainly don't want to single SPEC out
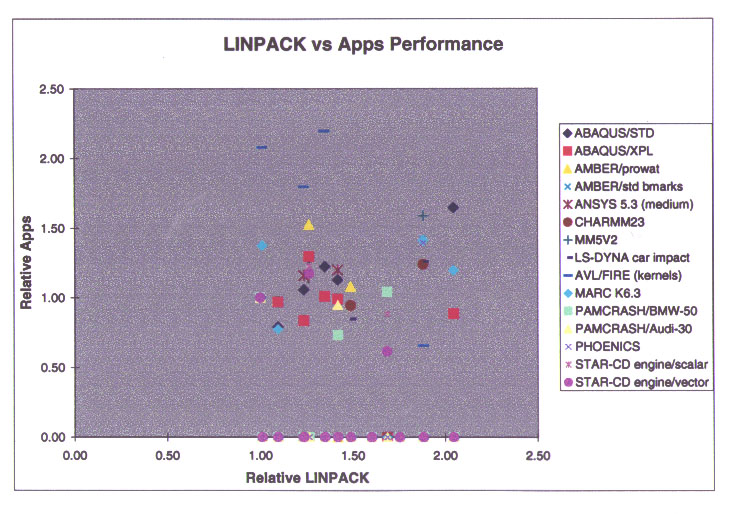
for ill-treatment. Here is some data I collected in 1998 on the usefulness
of the LINPACK 1000 benchmark for predicting application performance in
scientific and engineering applications.
I gathered all of the publicly available application
and LINPACK benchmark data on then-current server systems from SGI,
IBM, Sun, Compaq, and HP. For each machine where I had application
performance data, I took the ratio of that machine's application performance
relative to a 195 MHz SGI Origin2000 as the "y" value. The corresponding
"x" value is the ratio of the LINPACK 1000 performance of the sample machine
relative to the 195 MHz SGI Origin2000.
As you can see, the scatter in the data suggests
that there is no correlation at all!!!!
For those who like numbers, the correlation coefficient
is 0.015, and the best-fit curve has a slope of about 0.1 and a y-intercept
of about 0.9. That means that the best-fit curve says that
doubling the LINPACK performance corresponds to a 10% application
performance increase. Not a very useful predictor....
Although I have not included the chart here, the
STREAM benchmark is similarly useless for predicting application performance
for these scientific and technical applications.
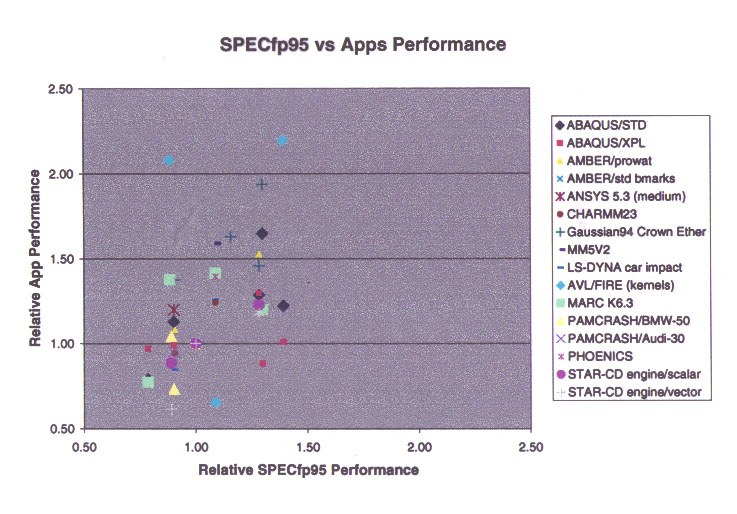
Are there better single figures of merit?
I found two of approximately equal predictive value. The first
is the SPECfp95 performance. The correlation coefficient is about
0.39, which is not great. The better news is that the slope of the
best-fit curve is almost exactly 1.0 and the y-intercept is almost exactly
0.0. So the best-fit curve suggests that (in an RMS average sense)
doubling the SPECfp95 score corresponds to doubling the application performance.
The second single-figure of merit predictor is
an optimal combination of the LINPACK and STREAM performance values.
I don't recall the relative coefficients, but the correlation coefficient
was about 0.36 -- pretty close to that of the SPECfp95 result.
The next section of the talk is a more detailed focus
on one particular application area: scientific and engineering computing.
I choose this area for discussion simply because I have lots of data, not
because such studies are uninteresting in other areas. To put
numbers on the discussion, the market for server systems for scientific
and engineering computing is about $6B/year, compared to the $24B/year
for general-purpose UNIX servers. So it is not a large market,
but not a negligible one, either.
Performance-Related Characteristics of Scientific and Engineering Applications
John McCalpin, IBM (mccalpin@us.ibm.com)
Ed Rothberg, ILOG (rothberg@ilog.com)
(This work was performed while the authors were employed by SGI)
Motivations and Assumptions
We suspected that both academia and industry were too focused
on standard benchmarks, and that these benchmarks might be significantly
different than commercially important applications.
We needed a broad study so that revenue-based
weighting could be used to interpret the results.
We chose commercial and community applications
because of their economic importance and relative stability.
What This Is:
A broad overview of the performance characteristics of commercial
and community codes in science and engineering.
A comparison of these performance characteristics with those
of a number of industry standard benchmarks.
Based solely on performance counter measurements from uniprocessor
runs of each application.
To give an idea of the value of performance
counter measurements for understanding application performance, I took
the counter results for the application set (described later) and plugged
them into a very simple CPI-based model. The model was not tuned
for this data set -- I simply applied what I thought the correct costs
should be per event for the target machine (a 195 MHz SGI Origin2000 with
4 MB L2 cache). Most of the predicted performance results were
within +/- 20% of the observed values, which seems pretty good for a model
with no actual knowledge of the microarchitecture.

What This Is NOT:
NOT a detailed study of the performance characteristics of
any individual application.
NOT based on any trace-driven or execution-driven simulations.
NOT providing any direct information about the performance
of any application.
Methodology
Applications chosen were "important" applications supported
by SGI.
The analyst in charge of each application chose a "relevant"
data set --- no toy problems!
Applications were run with full CPU performance counters
on an SGI Origin2000 system.
195 MHz CPU
4 MB L2 cache
1 GB local RAM
Application Coverage
Linear Finite Element Analysis (3 data sets, 2 applications)
Nonlinear Implicit Finite Element Analysis (8 data sets,
3 applications)
Nonlinear Explicit Finite Element Analysis (3 data sets,
3 applications)
Finite Element Modal (Eigenvalue) Analysis (6 data sets,
3 applications)
Computational Fluid Dynamics (13 data sets, 6 applications)
Computational Chemistry (7 data sets, 2 applications)
Weather/Climate Modelling (3 data sets, 2 applications)
Linear Programming (2 data sets, 2 applications)
Petroleum Reservoir Modelling (3 data sets, 2 applications)
Benchmark Coverage
NAS Parallel Benchmarks Version 1, Class B, pseudo-applications
(3 benchmarks)
NAS Parallel Benchmarks Version 1, Class B, kernels (5 benchmarks)
SPEC CFP95 (10 benchmarks)
SPEC CPU2000 (13 benchmarks -- one is missing)
LINPACK NxN (heavily optimized, N>1000)
STREAM (whole-program statistics)
Primary Metrics Analyzed
Execution Rate (MIPS)
Bandwidth Utilization
Main Memory
L2 cache
L1 cache
Cache Miss Statistics: Icache, Dcache, and L2 cache
TLB misses
Mispredicted Branches
Instruction Mix (FP, branch, LD/ST, other)
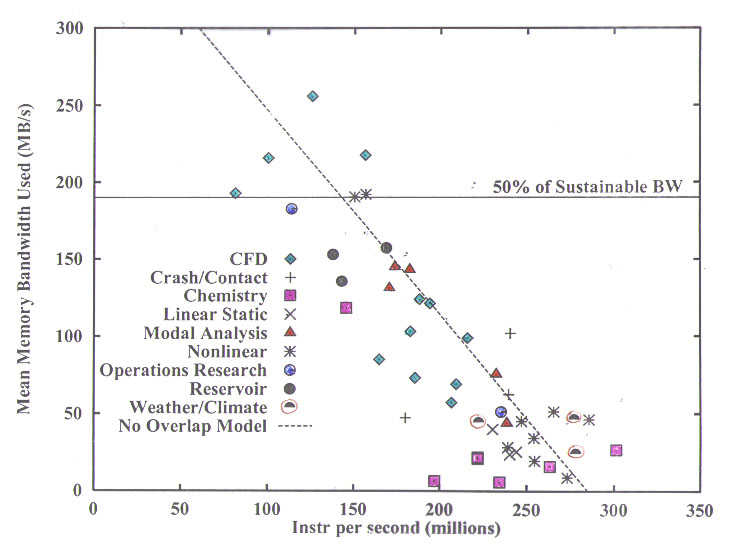
I begin with my standard overview chart, showing
the spread of execution rates vs memory bandwidth utilization. The
dashed line is a trivial model that assumes a core performance of 285 MIPS
and a stall on each cache line miss with a cost equal to the time per cache
line transfer measured using the TRIAD kernel of the STREAM benchmark.
It is not surprising that this simple model fits the data fairly well,
since the compiler used for this study (in early 1997) did not generate
prefetch instructions, and the OOO attributes of the machine are not adequate
to tolerate the ~60 cycles of main memory latency.
The most important thing to get from this picture
is that many of the application areas "clump" into regions of similar memory
bandwidth utilization, even using completely different codes from different
vendors, in some cases written in different decades!
The Computational Fluid Dynamics (CFD) codes
are an exception, with a long story that I don't have time to go into here....
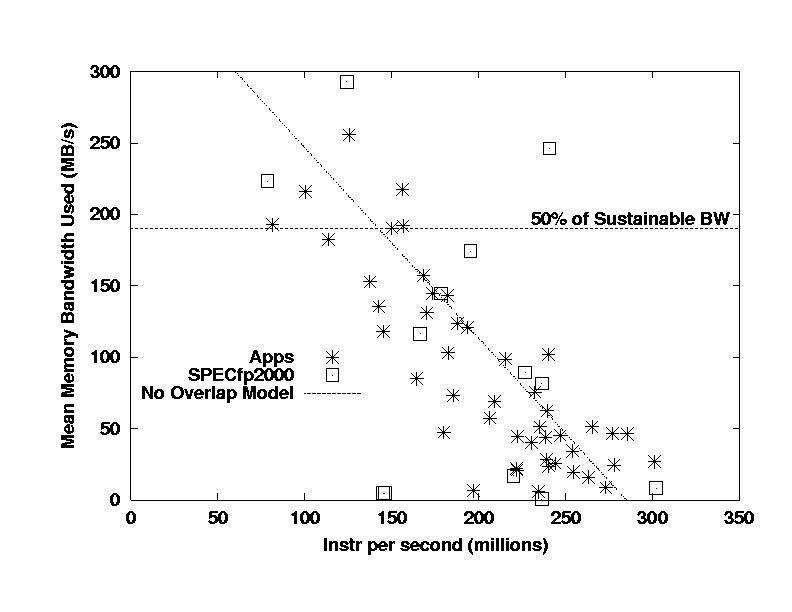
To keep this presentation manageable, I will limit
the following discussion to comparisons of the applications (all grouped
together) with the SPEC CFP2000 benchmarks. These results
were taken from a pre-release version of the benchmarks, and so may not
precisely correspond to the final version -- in particular, one of the
14 final benchmarks is missing from this set -- but I do not expect that
the overall performance characteristics changed much between this version
and the final version.
I begin with a repeat of the previous slide, but
with the applications grouped together and the CFP2000 benchmarks added.
The most important thing that I see in this picture is that the SPEC CFP2000
benchmarks do not capture the large group of applications with low bandwidth
demand and high IPC. In fact, it is not hard to convince one's self
that the overall bandwidth demand of the CFP2000 benchmarks is somewhat
higher than that of the real applications.
Now I move to a review of the L2 cache bandwidth
utilization. Interestingly, the SPEC benchmarks use less
bandwidth than the real applications. A code by code comparison shows
that in a number of cases, the L2 utilization for the SPEC CFP2000 benchmarks
is limited by the main memory bandwidth --- i.e., the data is streaming
through the L2 cache with minimal reuse.

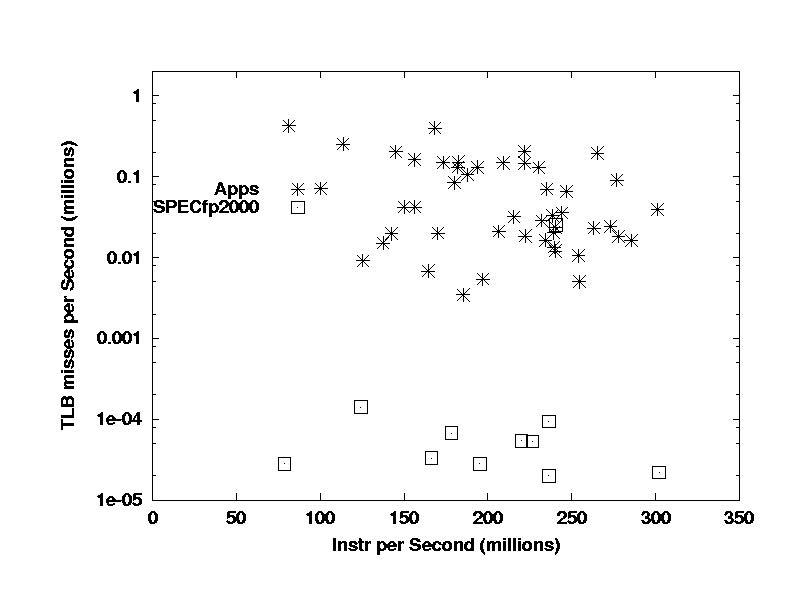
Now I jump to the TLB miss rate. Unfortunately,
these results are bogus, since the SPEC CFP2000 results were run using
large pages and therefore have anomalously low TLB miss rates. I
have done this comparison with the CFP95 benchmarks using small pages (i.e.
the same as the applications used) and found that the difference is real,
but the ratio of TLB miss rates is closer to one order of magnitude
than the three orders of magnitude shown here.
Recalling the last three slides, I showed that
the CFP2000 benchmarks
use more memory bandwidth
use less L2 bandwidth
have significantly lower TLB miss rates
Based on these items and discussions with
the application analysts, I make the following conjecture:
The SPEC CFP2000 benchmarks are
not effectively blocked for L2 cache and the SPEC CFP2000 benchmarks
access memory in a more regular (dominantly unit-stride) fashion than the
real applications.
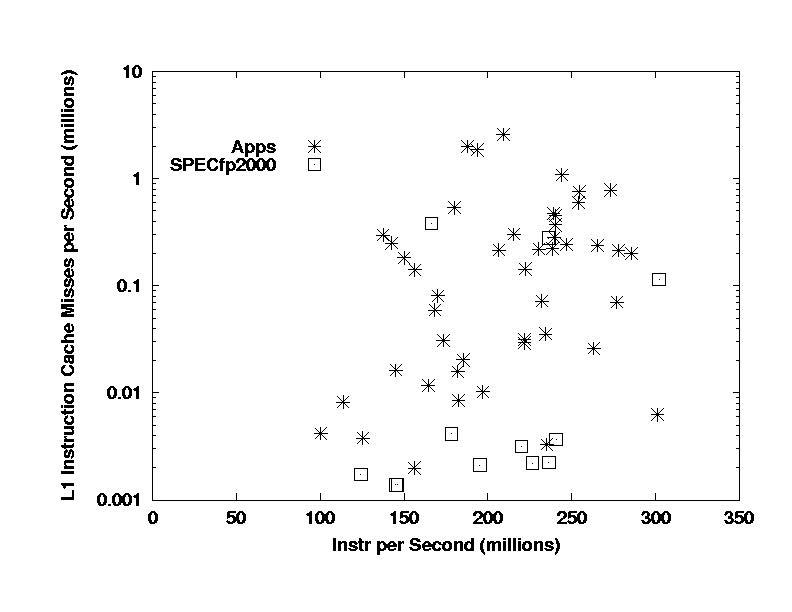
The next slide shows the Icache miss rates for the
benchmarks and applications, and shows that the SPEC benchmarks are
mostly at least an order of magnitude lower than the applications in Icache
miss rates. This is important because many of the applications have
Icache miss rates high enough to be ~10% contributors to the code's CPI
and cannot reasonably tolerate worse Icache performance (either higher
rates or bigger latency penalties for misses). The SPEC codes
are in agreement with the incorrect "traditional wisdom" that scientific
and engineering codes have minimal Icache performance requirements.
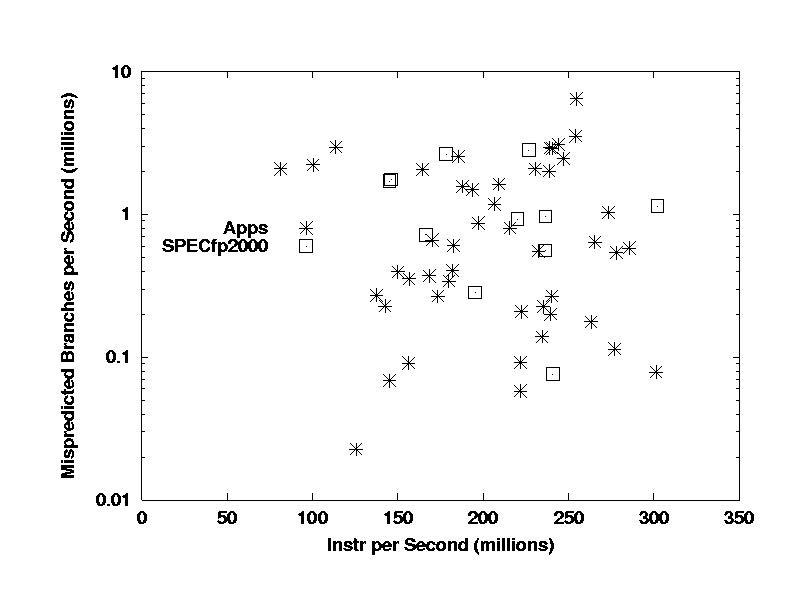
The SPEC codes show very good agreement in the
range and mean values of mispredicted branch rates. It is not
clear to me that these are correct for the right reason. Discussions
with the analysts have suggested that the real applications have significantly
more "IF" statements than the benchmarks, and it seems likely that many
of their mispredicted branches are due to these constructs. Reviewing
the SPEC CFP2000 codes suggests that most of the mispredicted branches
are associated with loop termination. This remains an area for further
investigation.
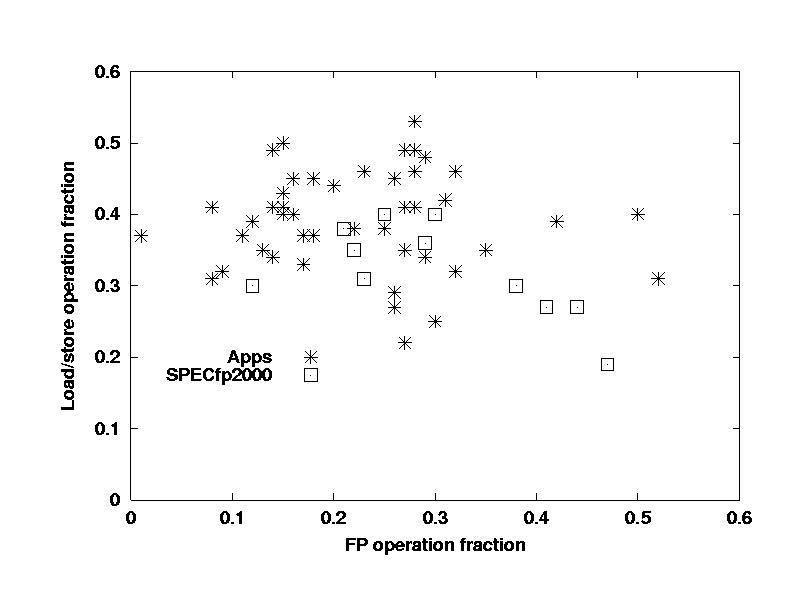
One of the most interesting results of the study
is in the dynamic instruction distribution. The following chart shows
the load/store operation fraction vs the floating-point operation fraction.
Note that the real applications are typically only 10%-30% FP instructions,
while the SPEC benchmarks range from 22%-45% FP. The important
microarchitectural feature is the ratio of loads and stores to FP operations
-- for the applications it varies from 1 to 4 with a mean of about 2, while
for the benchmarks it ranges from 0.75 to 2, with a mean near 1.
Conjecture:
Real applications have many loads and
stores associated with register spills due to complex inner loop bodies.
The SPEC CFP2000 codes have few spills because their inner loop bodies
are much simpler.
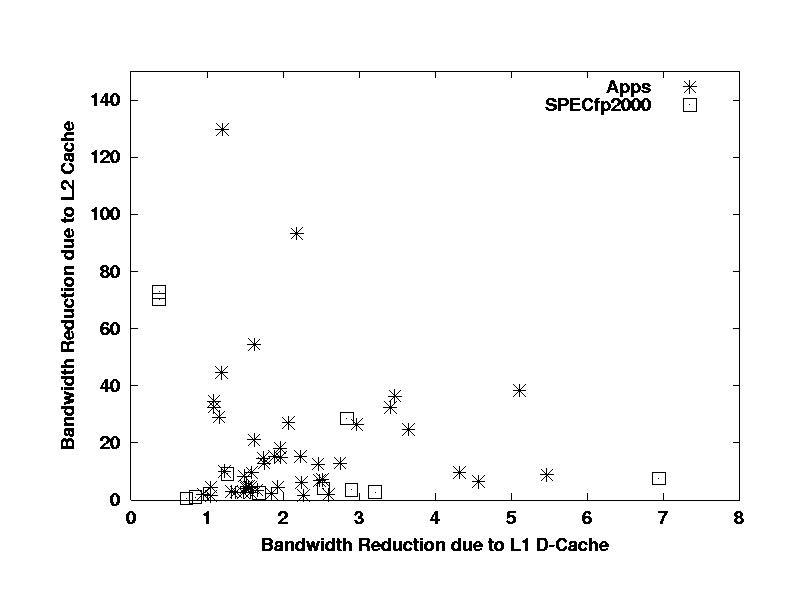
Finally, I review the role of the caches as "bandwidth
reducers". The "bandwidth reduction factor" is defined for each level
of the cache hierarchy as the bandwidth going "in" (toward or from the
core or lower levels of the cache hierarchy) divided by the bandwidth going
"out" (to/from memory or the next outer level of the cache hierarchy).
I define these separately for the L2 and L1 (data) caches, and note that
the total bandwidth reduction parameter is the product of these two values.
The L1 bandwidth reduction parameters for the
SPEC CFP2000 benchmarks cover pretty much the same range as those
of the real applications, with a few outliers.
The L2 bandwidth reduction parameters for the
SPEC CFP2000 benchmarks do not show the same pattern as the applications,
which have many results in the range of 10 to 50, where there is only one
SPEC CFP2000 results. The SPEC CFP2000 results also have
two outliers, with L2 bandwidth reduction parameters of 1500 and 4000,
respectively, corresponding to fully cache-contained codes. There
were no fully cache-contained application test cases.
These results are consistent with the conjecture
that the SPEC CFP2000 codes are not effectively blocked for L2 cache,
while many of the applications are effectively blocked.
Summary
We surveyed 25 applications processing a total of 48 data
sets
Performance-related application characteristics differed
significantly from standard benchmarks in:
memory bandwidth used
dynamic instruction mix
Icache miss rate
TLB miss rate
Conclusions
Current CPU-intensive benchmarks have some similarities
with economically important applications, but also many important
differences.
These benchmarks are not useful for engineering
trade-offs until the degree of similarity that they show with applications
is quantified.
In order to make this quantitative evaluation, we need
to gather and share a lot more data from real applications.
The SPEC CPU committee is investigating conducting
such a shared survey in support of the development of the SPEC CPU
200x benchmark suite.
Revised to 2000-10-04
John McCalpin
john@mccalpin.com