MNIST with Random Forest
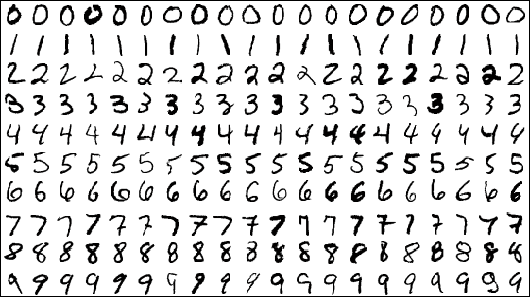
This is a demonstration of the Automata-based Random Forest algorithm trained with the MNIST dataset. The MNIST dataset is composed of handwritten digits. The dataset comes with a 60,000 training samples, and a seperate 10,000 testing samples.
Parameter Exploration For Training
In order to maximize the throughput of our classifier, it is necessary to minimize the size of the Random Forest model, while maintaining an acceptable accuracy. There are several design 'knobs' that we can use when training our Random Forest model, so it is necessary to explore the parameter space. Two important design parameters to consider for Random Forest training are the number of decision trees in the Ensemble (a set of classifiers), and the maximum depth (or maximum number of leaves) of each tree. These parameters directly affect the size and runtime of the model. Their affect on the accuracy of the model is less obvious.

We used Scikit Learn to train the Random Forest model on the MNIST training data. By adjusting the parameters at training time and testing the model with the testing data, we could obtain an accuracy metric. The graph above shows accuracy as a function of tree depth and the number of trees in the Random Forest. Each Random Forest was trained 10 times and the resulting accuracy score was averaged to account for slight variations between Forests. The graph shows a logarithmic relationship between both parameters and accuracy. Our results show that the accuracy saturated with trees of depth 14 or greater, and a tree count of 20 or above.


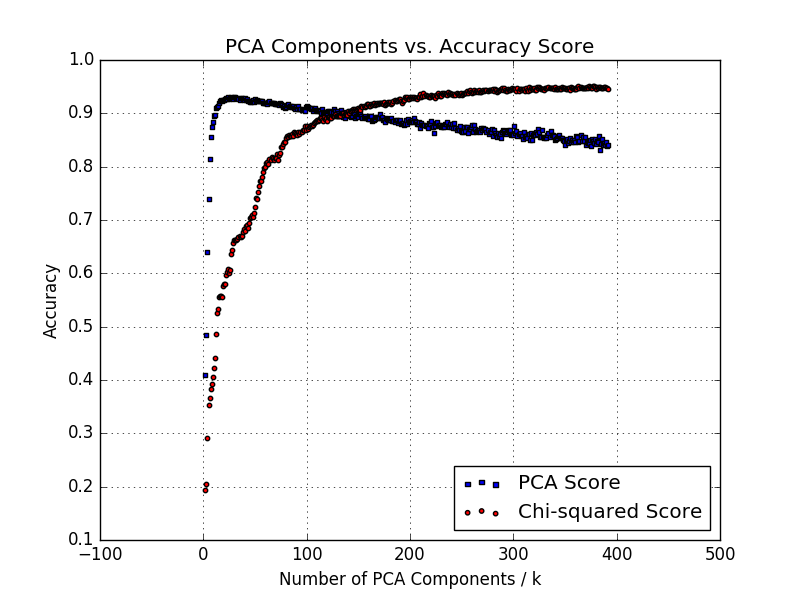
The next step was to determine the affect of reducing the input dimensionality on the accuracy. To do this, we tested two techniques: Principle Component Analysis (PCA) and the chi-squared statistical test with Scikit-Learn's selectKBest function. The results above indicate that our accuracy saturates at around 95% by only using 15 PCA components or 300 feature values. Considering the structure of our algorithm, we could not use PCA components, and instead reduced our input feature dimensionality from 28x28=784 to 300 pixels. The purpose of this is to reduce the running time of the algorithm as well as to reduce the model's size. After reducing the dimensionality of the input values, we performed the same feature exploration and generated the above plots. The error incurred by the significant reduction in feature dimensionality is small at approximately 0.3%.
A Demo
For the purposes of a simple demonstration, we simplified the MNIST Random Forest. We set the number of trees in the Ensemble to 10, and the maximum depth of the trees to 8. This resulted in a model containing 10 trees with approximatelty 256 (28) leaf nodes per tree. This corresponds to 256 automata per tree, or 2,560 total automata for the Forest on the AP. This simplified Random Forest allowed us to fit the entire model in a single chip on the Automata Processor at the expense of accuracy. Our model was able to achieve a maximum accuracy of 90%.
There are four boxes below. The first one is for input; draw a number into the first box. The input is centered, scaled, and sampled into a 28x28 matrix. The second box shows the resulting values for each of the 28x28 pixels which serve as features for the Random Forest model. Our above parameter exploration indicated that only 300 of the available 784 pixel values are needed to achieve a good accuracy. The third box shows the resulting dimensional reduction by feature selection. This third box shows the resulting features that the Random Forest considers for classification.
Finally, the bottom-most box represents all of the Random Forest automata. There are ten rows of automata, one row per constituent decision tree. There are 256 automata, one per leaf node, for each tree. When classifying an input, onely one of these automata will report. After drawing a number into the first box, press the 'recognize' button. The two other top boxes will fill with feature extraction and feature selection results, respectively. The resulting input is then sent to a server running an Automata Processor (AP). The input is processed by the AP, and the resulting automata and their classification results are displayed in the bottom-most box by small rectangles. The row that the box is displayed indicates the tree corresponding to the report, and the column corresponds to the specific automaton. Finally, the color of the rectangle indicates the guessed classification.